Tag Archives: NSCA

NRDP for Nagios Core on CentOS 7.x

Introduction

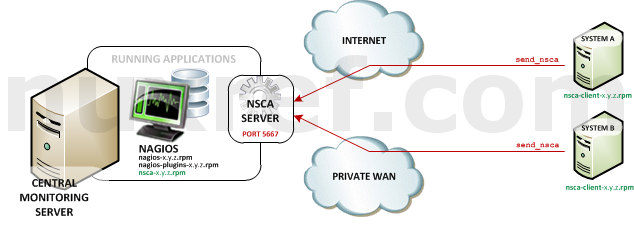
In continuation to part 1 of this blog series… NRDP (Nagios Remote Data Processor) is a Client/Server plugin for Nagios. With the NRDP model, it is the Application (or the server hosting it) that is responsible for reporting in it’s status. The beauty of this is you can have applications installed all throughout your business, your home, across data centers, overseas, etc all reporting to 1 single Nagios instance. You can monitor your entire infrastructure with this tool.

NRDP Overview
NRDP Overview

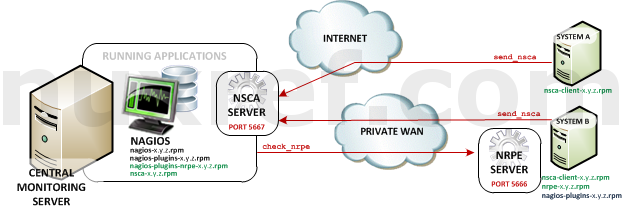
The diagram above illustrates how the paradigm works.

  • The A represents the Application Server. There is no limit to the number of these guys.
  • The N represents the Nagios Server. You’ll only ever need one Nagios server.
  • The Application (and/or the server hosting it) will make periodic status reports to the Nagios server. It should report that everything is okay, or report that it isn’t. Out of the box (using my rpms) Nagios will wait for up to X minutes (configurable) for a message to be received before reporting the service/host as being offline. Ideally you should send at least 2 or 3 notifications within this grace period. Currently X is set to 5 minutes with the templates in the RPMs I provide. But you can change this.
  • If Nagios doesn’t hear from the Application for an extended period of time, then it assumes the worst and reports to the user that there is a problem.

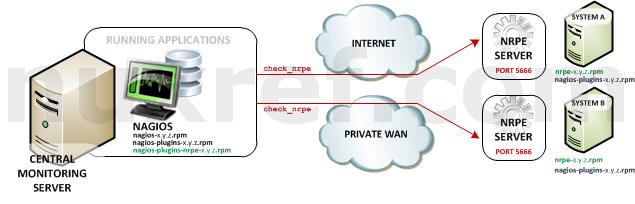
NRDP is a newer chapter in the Nagios world which allows you to monitor more applications you wouldn’t have otherwise been able to do. NRDP replaces it’s predecessor NSCA which performs the exact same task/function. One of the key differences is that NRDP is much easier to set up and use than NSCA is. NRDP is also much less lines of code too! The RPMs I provide make the setup even easier. That said, if you’re interested in using NSCA instead, I still package it here (and client here). But lets get back to talking about NRDP….

NRDP Clients pushing to Central NRDP Server

Here is what you’re getting with this blog and the packaged rpms that go with it:

  • Nagios Core v4.x: updated RPM packaging which I continued to maintain and carry forward from my previous blogs.
    Note: You will need this installed in order to use NRDP. See part 1 of this blog series for more information if you don’t already have it set up.
  • NRDP (Nagios Remote Data Processor) v1.x: My custom RPM packaging to just work for everyone right out of the box. Here are some modifications I made to the package to make our lives easier:
    • The default insecure port is configured to use 5668.
    • The default secure port is configured to use 5669.
    • I included my own Apache configuration so that the service would run right out of the box.
    • There are a several patches I had to make in order for the NRDP package to even work in our CentOS environment.
    • There is firewall configuration all ready to use with FirewallD.

Best of all, with my RPMs, you can run SELinux in full Enforcing mode for that extra piece of mind from a security standpoint!

The Goods

For those who really don’t care and want to just jump right in with the product. Here you go!

You can download the packages manually if you choose, or reference them using my repository:

Package Download Description
nrdp el7.rpm The NRDP Server: This must be installed on the same server running Nagios. It is in charge of listening to requests sent by nrdp-clients and reporting their status directly to Nagios. Don’t forget to change your tokens which we’ll discuss further down if you don’t know what I’m talking about!
nrdp-selinux el7.rpm An SELinux add-on package that allows the NRDP Server to operate under Enforcing Mode.

Note: This RPM is not required by the NRDP server to run correctly.
nrdp-client el7.rpm The NRDP Client: You’ll only need to optionally install this on to the remote servers that will be sending their status along to your NRDP Server. Since the protocol is so simple to adapt, you can also just choose to build the client aspect into the program you want to monitor with. If you do choose to install this RPM, you get access to a small program called send_nrdp.php which allows you to post status messages to the Nagios Server.
nrdp-doc el7.rpm Just some documentation that is already publicly available on NRDP’s website.
Note: This RPM is not required by Nagios to run correctly.

Note: The source rpm can be obtained here which builds everything you see in the table above. It’s not required for the application to run, but might be useful for developers or those who want to inspect how I put the package together.

NRDP Server Side Configuration

The NRDP Server is only going to work if it’s installed on the same server as Nagios.

Assuming you hooked up to my repository here, the NRDP server can can be easily installed with the following command:

# Install NRDP (Server) on the same server as the one running Nagios
yum install nrdp nrdp-selinux

NRDP was written in PHP and therefore depends on a few small tweaks on your part. For one, you’ll want to make sure you have a timezone configured too to silence any potential errors and keep the reporting consistent. You’ll want to do this from your /etc/php.ini file; look for a directive called date.timezone. Here is a list of supported timezones by PHP. But you can also just do this which works too:

# This clever trick (a 1 liner) lets the timezone in the /etc/php.ini
# to that of whatever your current system is set to!
sed -i -e "s/^[; \t]\?\(date\.timezone\)[ \t]*=.*/\1 = \"$(date +%Z)\"/g" \
   /etc/php.ini

If Apache isn’t running; now’s the time to start it up.

# This simple command should be ran as root and will
# start Apache if it isn't running already, otherwise it
# will send a reload signal if it is.  Regardless,
# after you finish this command, the new NRDP Configuration
# will be running and ready to go.
systemctl status httpd.service && \
   systemctl reload httpd.service || \
   systemctl start httpd.service

# Make sure we start up on reboots (if we haven't done so already)
systemctl enable httpd.service

NRDP/Nagios Configuration

You need to let Nagios know what services it should expect notifications from. The key thing that separates these entries from any other Nagios entries you specified is the ‘use‘ directive. For hosts reporting in, you’ll want to use the generic-nrdp-host directive. For services reporting in, you’ll want to use the generic-nrdp-service entry.

A Configuration file on your Nagios Server (the same server running your NRDP Server) might look like this:

cat << _EOF > /etc/nagios/conf.d/somehost.cfg
# We might have a test server defined like this
define host {
    # Name of host template to use (notice we're using the
    # 'generic-nrdp-host' template).  If you want to actively ping
    # this server and not await to hear from it, you can change this
    # to use the 'linux-server' template instead.
    use                         generic-nrdp-host
    # Hostname
    host_name                   somehost
    # Human Readable
    alias                       My Test Server
}

# Now we might identify a component to associate with our test server called <em>somehost</em>.
define service{
   use                 generic-nrdp-service
   service_description someservice
   host_name           somehost
}
_EOF

With the templates I provide, Nagios will wait for up to 5 minutes for a notification before assuming nothing is coming (and changing the state to CRITICAL). If this is too long (or too short) of a wait time for you, you can change it by modifying the NRDP templates (or creating your own). The provided NRDP templates can be found here: /etc/nagios/conf.d/nrdp.conf. You’ll want to focus on the entry entitled freshness_threshold which is currently set to 300 (300 seconds is equal to 5 minutes) and change it to your liking.

Alternatively, you can over-ride the template value by just adding the freshness_threshold to the service configuration you create like so:

cat << _EOF > /etc/nagios/conf.d/somehost.10min.service.cfg
# Over-ride our template timeout with a new one specified
# in our service declaration
define service{
   use                 generic-nrdp-service
   service_description someservice
   host_name           somehost
   # Over-ride the defaults in our template and only go stale
   # if 10 minutes elapses (600 seconds = 10 min)
   freshness_threshold 600
}
_EOF

If you’ve modified your configuration in anyway; be sure to reload Nagios so that it can take in our new configuration:

# Reload our service (if it's running)
systemctl reload nagios.service

# Be sure to start it if it isn't already:
systemctl start nagios.service

Testing your NRDP Server Setup

Once NRDP is up and running it will provide you a simple website you can use to interact with it. This interface allows you to manually send passive checks through to Nagios which is really useful for testing if everything is working okay!

Here is what the test page looks like:

NRDP Server Side
NRDP Server Side – use nuxref as a token to test with.

Note: The blog does not touch on the Submit Nagios Command portion of this page; but that’s another topic for another day. You want to focus on the Submit Check Data section.

To use NRDP you will be required to provide a token with every submission you ever make to it. This is just a security feature to prevent people from sending messages into your system who shouldn’t be. By default (if you’re using my rpms), the token is nuxref. You’ll notice in the above example, I’ve gone ahead and filed this field in to show you where it goes.

To change this token (which you really should do) just open up the php file /etc/nrdp/config.php. You can specify as many tokens as you like that you wish to accept. Here is what you’re looking for:

// ...
// look for the authorized_tokens directive
// and add your tokens here:
$cfg['authorized_tokens'] = array(
   "the-longer-and-more-encrypted-your-token-is-the-better",
   "specify-as-many-tokens-as.-you-want",
);

If you followed the blog so far and created the test examples I provided (above), then you can now submit a passive check using the default settings; don’t forget to provide your token!

If everything goes according to plan, you should be able to check out your message safely being acknowledged:

NRDP Test Submission Results (using defaults)

NRDP Server Security

Since you can access a very simple NRDP webpage on the same server hosting Nagios via http://localhost:5668/ (insecure) or https://localhost:5669/ (secure), you’ll want to protect it from those who shouldn’t be visiting it.

The below commands open up the protocol to everyone on your network. You should only perform this command if your Nagios Server will be running on a local private network:

# Enable insecure NRDP port (5668)
firewall-cmd --permanent --add-service=nrdp
firewall-cmd --add-service=nrdp

# Enable secure NRDP port (5669)
firewall-cmd --permanent --add-service=nrdps
firewall-cmd --add-service=nrdps

If you’re opening this up to the internet, then you might want to just open the (NRDP) port(s) exclusively used by the remote applications you intend to allow reporting from. It might be worth investing time into fail2ban as well as an additional precaution. The following presumes you know the IP of the application server and will open access to ‘JUST’ that system:

# Assuming 1.2.3.4 belongs to a system you trust who will be sending you
# Nagios status reports via NRDP:
firewall-cmd --permanent --zone=public \
   --add-rich-rule='\
       rule family="ipv4" \
       source address="1.2.3.4/32" \
       port protocol="tcp" \
       port="5668" \
       accept'

# Here is the Secure version of the same command
firewall-cmd --permanent --zone=public \
   --add-rich-rule='\
       rule family="ipv4" \
       source address="1.2.3.4/32" \
       port protocol="tcp" \
       port="5669" \
       accept'

Note: Again, I want to stress you should only open ports you intend to use and to the Application Servers who intend to use it. If you don’t intend on using the insecure port, then don’t even open it on your firewall!

Once you’re satisfied that everything is working. You might want to disable GET requests on your NRDP Server. This will prevent people from using the test website and only accept POST requests. To do this, just have a look in /etc/httpd/conf.d/nrdp.conf and uncomment (hence, remove the #) the line that reads:

RewriteCond %{REQUEST_METHOD} !^(POST) [NC]

You’ll need to reload your Apache server for the changes to take effect. If ever you want to test again, just comment the line back out again:

# This simple command should be ran as root and will
# start Apache if it isn't running already, otherwise it
# will send a reload signal if it is.  Regardless,
# after you finish this command, the new NRDP Configuration
# will be running and ready to go.
systemctl status httpd.service && \
   systemctl reload httpd.service || \
   systemctl start httpd.service

# Make sure we start up on reboots (if we haven't done so already)
systemctl enable httpd.service

NRDP Client Side Configuration

The protocol is so simple, that you can easily adapt this into programs you write or tool-sets. You can also just simple use the tool provided

# Install Nagios Core using NuxRef
# See: https://nuxref.com/repo for more information
# Install NRDP Client (CLI) on any server you want to
# be able to report it's status to (onto Nagios)
yum install nrdp-client

Now… from our application server we would want to install our nrdp-client package. so that we can access our send_nrdp.php tool.

The tool is very simple to use; here is an example how you can send a simple status message to our Nagios server:

# The below sends a host acknowledgment to our NRDP server
# url:   web address to our Nagios server
# token: the security token (this is to prevent anyone from
#        sending status requests to your Nagios server.
#        The default is 'nuxref' until you change it (which you
#        really should consider doing)
# state: This will work the color coding of Nagios, you can
#        specify one of the following:
#           0 - OKAY (green)
#           1 - WARNING (yellow/orange)
#           2 - CRITICAL (red)
#           3 - UNKNOWN (blue)
# output: Attach a message with our state; this will be visible
#         as well from the Nagios display screen:

# Here is a NRDP notification:
send_nrdp.php --url=http://nagios.server.addr:5668 --token=nuxref \
   --host=somehost \
   --state=0 \
   --output="Test is is working great."

# This will send a warning status to our component we identified
send_nrdp.php --url=http://nagios.server.addr:5668 --token=nuxref \
   --host=somehost \
   --state=0 \
   --output="Test is is working great."

Note: It’s worth noting that there are no WARNING states for hosts. A zero (0) will report that it is online, and anything else will report it as CRITICAL.

NRDP Protocol

Are you a developer? If you are, you may want to avoid using the script and just talk directly to the NRDP Server from your application. It’s incredibly easy to do. If you’re not, don’t worry; the send_nrdp.php script looks after all of this for you. You can still read this section if you’re interested none the less.

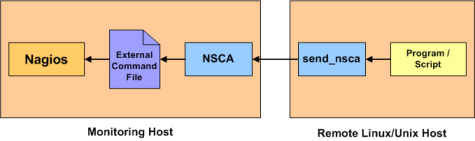
NRDP is literally just a small PHP website that relays XML it receives via it’s restful API into a language that Nagios can interpret. In fact NRDP is just a website that writes specially formatted files into the /var/nagios/spool/checkresults/ directory to which Nagios scans for processing.

The NRDP Payload

The payload is XML; the schema looks like this:

<?xml version='1.0'?> 
<!-- For checking a host -->
<checkresults>
    <!-- The type can be either 'host' or 'service' -->
    <!-- The checktype is always 1 for relaying passive status updates -->
  <checkresult type='host' checktype='1'>
    <hostname>somehost</hostname>
    <!-- 0 = Success, 1 = Warning, 2 = Critical -->
    <state>0</state>
    <!-- A message we might want to associate  -->
    <output>Our somehost is behaving perfectly!</output>
  </checkresult>
</checkresults>

Easy peasy right? A Service message looks like this:

<?xml version='1.0'?> 
<!-- For checking a service -->
<checkresults>
    <!-- The type can be either 'host' or 'service' -->
    <!-- The checktype is always 1 for relaying passive status updates -->
  <checkresult type='service' checktype='1'>
    <!-- This has to be the hostname associated with the service -->
    <hostname>somehost</hostname>
    <!-- This has to be the service we configured using our NRDP
         template.  It's identified by the `service_description`
         field as part of our nagios configuration. -->
    <servicename>someservice</servicename>
    <!-- 0 = Success, 1 = Warning, 2 = Critical -->
    <state>2</state>
    <!-- A message we might want to associate  -->
    <output>Danger Will Robinson! Danger!</output>
  </checkresult>
</checkresults>

You can stack as many messages as you want in a single payload which really adds to NRDPs flexibility:

<?xml version='1.0'?> 
<!-- A mix of status updates -->
<checkresults>
  <checkresult type='host' checktype='1'>
    <hostname>somehost</hostname>
    <state>0</state>
    <output>Our testserver is behaving perfectly!</output>
  </checkresult>

  <checkresult type='service' checktype='1'>
    <hostname>somehost</hostname>
    <servicename>someservice</servicename>
    <state>2</state>
    <output>Houston, we have a problem.</output>
  </checkresult>

  <checkresult type='service' checktype='1'>
    <hostname>somehost</hostname>
    <servicename>my-other-service</servicename>
    <state>1</state>
    <output>Let's hope the problem goes away.</output>
  </checkresult>

</checkresults>

The Transaction

Since it’s a PHP website, it’s hosted via Apache, NginX, etc. This blog sets up Apache but nothing is stopping you from using another service.

This means however that all interactions are web requests. A transaction must be an URL encoded HTTP POST and it must include a special token as part of its payload (part of the verification process). If the token specified is invalid or missing, then the NRDP server will just reject the message. The same rules apply if you don’t POST the message.

You could accomplish this with Python like so:

#!/usr/bin/env python
# -*- coding: utf-8 -*-
# Site: https://nuxref.com
# Desc: A simply python snip-it to show you how easy it is
#       to interface with NRDP server:
#
# Note: 'requests' (which is required) can be installed 
#       like so (if you don't already have it):
#  #> yum install python-requests
import requests

xml = """<?xml version='1.0'?> 
<checkresults>
  <checkresult type='service' checktype='0'>
    <hostname>somehost</hostname>
    <servicename>someservice</servicename>
    <state>0</state>
    <output>Everything is running great!</output>
  </checkresult>
</checkresults>"""

params = {
   'token': 'nuxref',
   'cmd': 'submitcheck',
   'XMLDATA': xml,
}
r = requests.post(
    'https://nagios.server.addr:5669',
    params=params,
    headers={'Content-Type': 'application/xml'},
    # This is only in place for those who have self signed secure
    # certificates for private networks; you may wish to change
    # this to True in a real environment if you have the ability
    # to verify the host
    verify=False,
)

# Ideally you want to see: 200
print(r.status_code)

# Print our data
print(r.text)

Credit

This blog took me a very (,very) long time to put together and test! The repository hosting alone accommodates all my blog entries up to this date. All of the custom packaging described here was done by me personally. I took the open source available to me and rebuilt it to make it an easier solution and decided to share it.

NRDP certainly does not work like this out of the box; here were the patches I created (see pull request #12 on NRDPs Repository for upstream pushes of this):

  1. nrdp-php_headerfix.patch: Fix PHP header so tool can be executed on the shell.
  2. nrdp-basic_authorized_token.patch:Default (nuxref) token for an out-of-the-box working solution.
  3. nrdp-date.timezone.warning.patch: Silence potential Timezone Warning Message.
  4. nrdp-permissions.patch: Better passive check permission handling for NRDP/Nagios
  5. nrdp-client-support_ports.patch: Support more then just port http 80 (as this blog sets up our NRDP server using ports 5669 and/or 5668).

If you like what you see and wish to copy and paste this HOWTO, please reference back to this blog post at the very least. It’s really all I ask.

Sources

Configuring and Installing NRPE and NSCA into Nagios Core 4 on CentOS 6

Introduction

About a month ago I wrote (and updated) an article on how to install Nagios Core 4 onto your system. I’m a bit of a perfectionist, so I’ve rebuilt the packages a little to accommodate my needs. Now I thought it might be a good idea to introduce some of the powerful extensions you can get for Nagios.

For an updated solution, you may wish to check out the following:

  • NRDP for Nagios Core on CentOS 7.x: This blog explains how awesome NRDP really is and why it might become a vital asset to your own environment. This tool can be used to replace NSCA’s functionality. The blog also provides the first set of working RPMs (with SELinux support of course) of it’s kind to support it.
  • NRPE for Nagios Core on CentOS 7.x: This blog explains how to set up NRPE (v3.x) for your Nagios environment. At the time this blog was written, there was no packaging of it’s kind for this version.

RPM Solution

RPMs provide a version control and an automated set of scripts to configure the system how I want it. The beauty of them is that if you disagree with something the tool you’re packaging does, you can feed RPMs patch files to accommodate it without obstructing the original authors intention.

Now I won’t lie and claim I wrote these SPEC files from scratch because I certainly didn’t. I took the stock ones that ship with these products (NRPE and NSCA) and modified them to accommodate and satisfy my compulsive needs. πŸ™‚

My needs required a bit more automation in the setup as well as including:

  • A previous Nagios requirement I had was a /etc/nagios/conf.d directory to behave similar to how Apache works. I wanted to be able to drop configuration files into here and just have it work without re-adjusting configuration files. In retrospect of this, these plugins are a perfect example of what can use this folder and work right out of the box.
  • These new Nagios plugins should adapt to the new nagiocmd permissions. The nagioscmd group permission was a Nagios requirement I had made in my previous blog specifically for the plugin access.
  • NSCA should prepare some default configuration to make it easier on an administrator.
  • NSCA servers that don’t respond within a certain time should advance to a critical state. This should be part of the default (optional) configuration one can use.
  • Both NRPE and NSCA should plug themselves into Nagios silently without human intervention being required.
  • Both NRPE and NSCA should log independently to their own controlled log file that is automatically rotated by the system when required.

Nagios Enhancement Focus

The key things I want to share with you guys that you may or may not find useful for your own environment are the following:

  • Nagios Remote Plugin Executor (NRPE): NRPE (officially accessed here) provides a way to execute all of the Nagios monitoring tools on a remote server. These actions are all preformed through a secure (private) connection to the remote server and then reported back to Nagios. NRPE can allow you to monitor servers that are spread over a WAN (even the internet) from one central monitoring server. This is truly the most fantastic extension of Nagios in my opinion.
    NRPE High Level Overview
    NRPE High Level Overview
  • Nagios Service Check Acceptor (NSCA): NSCA (officially accessed here) provides a way for external applications to report their status directly to the Nagios Server on their own. This solution still allows the remote monitoring of a system by taking the responsibility off of the status checks off of Nagios. However the fantastic features of Nagios are still applicable: You are still centrally monitoring your application and Nagios will immediately take action in notifying you if your application stops responding or reports a bad status. This solution is really useful when working with closed systems (where opening ports to other systems is not an option).
    NSCA High Level Overview
    NSCA High Level Overview

Just give me your packaged RPMS

Here they are:

How do I make these packages work for me?

In all cases, the RPMs take care of just about everything for you, so there isn’t really much to do at this point. Some considerations however are as follows:

  • NRPE
    NRPE - Nagios Remote Plugin Executor
    NRPE – Nagios Remote Plugin Executor

    In an NRPE setup, Nagios is always the client and all of the magic happens when it uses the check_nrpe plugin. Most of NRPE’s configuration resides at the remote server that Nagios will monitor. In a nutshell, NRPE will provide the gateway to check a remote system’s status but in a much more secure and restrictive manor than the check_ssh which already comes with the nagios-plugins package. The check_ssh requires you to create a remote user account it can connect with for remote checks. This can leave your system vulnerable to an attack since you can do a lot more damage with a compromised SSH account. However check_nrpe uses the NRPE protocol and can only return what you let it; therefore making it a MUCH safer choice then check_ssh!

    You’ll want to install nagios-plugins-nrpe on the same server your hosting Nagios on:

    # Download NRPE
    wget --output-document=nagios-plugins-nrpe-2.15-1.el6.x86_64.rpm http://repo.nuxref.com/centos/6/en/x86_64/custom/nagios-plugins-nrpe-2.15-4.el6.nuxref.x86_64.rpm
    
    # Now install it
    yum -y localinstall nagios-plugins-nrpe-2.15-1.el6.x86_64.rpm
    

    Again I must stress, the above setup will work right away presuming you chose to use my custom build of Nagios introduced in my blog that went with it.

    Just to show you how everything works, we’ll make the Nagios Server the NRPE Server as well. In real world scenario, this would not be the case at all! But feel free to treat the setup example below on a remote system as well because it’s configuration will be identical! πŸ™‚

    # Install our NRPE Server
    wget --output-document=nrpe-2.15-1.el6.x86_64.rpm http://repo.nuxref.com/centos/6/en/x86_64/custom/nrpe-2.15-4.el6.nuxref.x86_64.rpm
    
    # Install some Nagios Plugins we can configure NRPE to use
    wget --output-document=nagios-plugins-1.5-1.x86_64.rpm http://repo.nuxref.com/centos/6/en/x86_64/custom/nagios-plugins-1.5-5.el6.nuxref.x86_64.rpm
    
    # Now Install it
    yum -y localinstall nrpe-2.15-1.el6.x86_64.rpm 
       nagios-plugins-1.5-1.x86_64.rpm
    # This tool requires xinetd to be running; start it if it isn't
    # already running
    service xinetd status || service xinetd start
    
    # Make sure our system will always start xinetd
    # even if it's rebooted
    chkconfig --level 345 xinetd on
    

    Now we can test our server by creating a test configuration:

    # Create a NRPE Configuration our server can accept
    cat << _EOF > /etc/nrpe.d/check_mail.cfg
    command[check_mailq]=/usr/lib64/nagios/plugins/check_mailq -c 100 -w 50
    _EOF
    
    # Create a temporary test configuration to work with:
    cat << _EOF > /etc/nagios/conf.d/nrpe_test.cfg
    define service{
       use                 local-service
       service_description Check Users
       host_name           localhost
       # check_users is already defined for us in /etc/nagios/nrpe.cfg
    	check_command		  check_nrpe!check_users
    }
    
    # Test our new custom one we just created above
    define service{
       use                 local-service
       service_description Check Mail Queue
       host_name           localhost
       # Use the new check_mailq we defined above in /etc/nrpe.d/check_mail.cfg
    	check_command		  check_nrpe!check_mailq
    }
    _EOF
    
    # Reload Nagios so it sees our new configuration defined in
    # /etc/nagios/conf.d/*
    service nagios reload
    
    # Reload xinetd so nrpe sees our new configuration defined in
    # /etc/nrpe.d/*
    service xinetd reload
    

    We can even test our connection manually by calling the command:

    # This is what the output will look like if everything is okay:
    /usr/lib64/nagios/plugins/check_nrpe -H localhost -c check_mailq
    OK: mailq is empty|unsent=0;50;100;0
    

    Another scenario you might see (when setting on up on your remote server) is:

    /usr/lib64/nagios/plugins/check_nrpe -H localhost -c check_mailq
    CHECK_NRPE: Error - Could not complete SSL handshake.
    

    Uh oh, Could not complete SSL handshake.! What does that mean?
    This is the most common error people see with the NRPE plugin. If you Google it, you’ll get an over-whelming amount of hits suggesting how you can resolve the problem. I found this link useful.
    That all said, I can probably tell you right off the bat why it isn’t working for you. Assuming you’re using the packaging I provided then it’s most likely because your NRPE Server is denying the requests your Nagios Server is making to it.

    To fix this, access your NRPE Server and open up /etc/xinetd/nrpe in an editor of your choice. You need to allow your Nagios Server access by adding it’s IP address to the only_from entry. Or you can just type the following:

    # Set your Nagios Server IP here:
    NAGIOS_SERVER=192.168.192.168
    
    # If you want to keep your previous entries and append the server
    # you can do the following (spaces delimit the servers):
    sed -i -e "s|^(.*only_from[^=]+=)[ t]*(.*)|1 2 $NAGIOS_SERVER|g" 
       /etc/xinetd.d/nrpe
    
    # The below command is fine too to just replace what is there
    # with the server of your choice (you can use either example
    sed -i -e "s|^(.*only_from[^=]+=).*|1 $NAGIOS_SERVER|g" 
       /etc/xinetd.d/nrpe
    
    # When your done, restart xinetd to update it's configuration
    service xinetd reload
    

    Those who didn’t receive the error I showed above, it’s only because your using your Nagios Server as your NRPE Server too (which the xinetd tool is pre-configured to accept by default). So please pay attention to this when you start installing the NRPE server remotely.

    You will want to install nagios-plugins-nrpe on to your NRPE Server as well granting you access to all the same great monitoring tools that have already been proven to work and integrate perfectly with Nagios. This will save you a great deal of effort when setting up the NRPE status checks.

    As a final note, you may want to make sure port 5666 is open on your NRPE Server’s firewall otherwise the Nagios Server will not be able to preform remote checks.

    ## Open NRPE Port (as root)
    iptables -A INPUT -m state --state NEW -m tcp -p tcp --dport 5666 -j ACCEPT
    
    # consider adding this change to your iptables configuration
    # as well so when you reboot your system the port is
    # automatically open for you. See: /etc/sysconfig/iptables
    # You'll need to add a similar line as above (without the
    # iptables reference)
    # -A INPUT -m state --state NEW -m tcp -p tcp --dport 5666 -j ACCEPT
    
  • NSCA
    NSCA - Nagios Service Check Acceptor
    NSCA – Nagios Service Check Acceptor

    Remember, NSCA is used for systems that connect to you remotely (instead of you connecting to them (what NRPE does). This is a perfect choice plugin for systems you do not want to open ports up to unnecessarily on your remote system. That said, it means you need to open up ports on your Monitoring (Nagios) server instead.

    You’ll want to install nsca on the same server your hosting Nagios on:

    # Download NSCA
    wget --output-document=nsca-2.7.2-9.el6.x86_64.rpm http://repo.nuxref.com/centos/6/en/x86_64/custom/nsca-2.7.2-10.el6.nuxref.x86_64.rpm
    
    # Now install it
    yum -y localinstall nsca-2.7.2-9.el6.x86_64.rpm
    
    # This tool requires xinetd to be running; start it if it isn't
    # already running
    service xinetd status || service xinetd start
    
    # Make sure our system will always start xinetd
    # even if it's rebooted
    chkconfig --level 345 xinetd on
    
    # SELinux Users may wish to turn this flag on if they intend to allow it
    # to call content as root (using sudo) which it must do for some status checks.
    setsebool -P nagios_run_sudo on
    

    The best way to test if everything is working okay is by also installing the nsca-client on the same machine we just installed NSCA on (above). Then we can simply create a test passive service to test everything with. The below setup will work presuming you chose to use my custom build of Nagios introduced in my blog that went with it.

    # First install our NSCA client on the same machine we just installed NSCA
    # on above.
    wget http://repo.nuxref.com/centos/6/en/x86_64/custom/nsca-client-2.7.2-10.el6.nuxref.x86_64.rpm
    
    # Now install it
    yum -y localinstall nsca-client-2.7.2-9.el6.x86_64.rpm
    
    # Create a temporary test configuration to work with:
    cat << _EOF > /etc/nagios/conf.d/nsca_test.cfg
    # Define a test service. Note that the service 'passive_service'
    # is already predefined in /etc/nagios/conf.d/nsca.cfg which was
    # placed when you installed my nsca rpm
    define service{
       use                 passive_service
       service_description TestMessage
       host_name           localhost
    }
    _EOF
    
    # Now reload Nagios to it reads in our new configuration
    # Note: This will only work if you are using my Nagios build
    service nagios reload
    

    Now that we have a test service set up, we can send it different nagios status through the send_nsca binary that was made available to us after installing nsca-client.

    # Send a Critical notice to Nagios using our test service
    # and send_nsca. By default send_nsca uses the '<tab>' as a
    # delimiter, but that is hard to show in a blog (it can get mixed up
    # with the space.  So in the examples below i add a -d switch
    # to adjust what the delimiter in the message.
    # The syntax is simple:
    #    hostname,nagios_service,status_code,status_msg
    #
    # The test service we defined above identifies both the
    # 'host_name' and 'service_description' define our first 2
    # delimited columns below. The status_code is as simple as:
    #       0 : Okay
    #       1 : Warning
    #       2 : Critical
    # The final delimited entry is just the human readable text
    # we want to pass a long with the status.
    #
    # Here we'll send our critical message:
    cat << _EOF | /usr/sbin/send_nsca -H 127.0.0.1 -d ','
    localhost,TestMessage,2,This is a Test Error
    _EOF
    
    # Open your Nagios screen (http://localhost/nagios) at this point and watch the
    # status change (it can take up to 4 or 5 seconds or so to register
    # the command above).
    
    # Cool?  Here is a warning message:
    cat << _EOF | /usr/sbin/send_nsca -H 127.0.0.1 -d ',' -c /etc/nagios/send_nsca.cfg
    localhost,TestMessage,1,This is a Test Warning
    _EOF
    
    # Check your warning on Nagios, when your happy, here is your
    # OKAY message:
    cat << _EOF | /usr/sbin/send_nsca -H 127.0.0.1 -d ',' -c /etc/nagios/send_nsca.cfg
    localhost,TestMessage,0,Life is good!
    _EOF
    

    Since NSCA requires you to listen to a public port, you’ll need to know this last bit of information to complete your NSCA configuration. Up until now the package i provide only open full access to localhost for security reasons. But you’ll need to take the next step and allow your remote systems to talk to you.

    NSCA uses port 5667, so you’ll want to make sure your firewall has this port open using the following command:

    ## Open NSCA Port (as root)
    iptables -A INPUT -m state --state NEW -m tcp -p tcp --dport 5667 -j ACCEPT
    
    # consider adding this change to your iptables configuration
    # as well so when you reboot your system the port is
    # automatically open for you. See: /etc/sysconfig/iptables
    # You'll need to add a similar line as above (without the
    # iptables reference)
    # -A INPUT -m state --state NEW -m tcp -p tcp --dport 5667 -j ACCEPT
    

    Another security in place with the NSCA configuration you installed out of
    the box is that it is being managed by xinetd. The configuration can
    be found here: /etc/xinetd.d/nsca. The security restriction in place that you’ll want to pay close attention to is line 16 which reads:

    only_from = 127.0.0.1 ::1

    If you remove this line, you’ll allow any system to connect to yours; this is a bit unsafe but an option. Personally, I recommend that you individually add each remote system you want to monitor to this line. Use a space to separate more the one system.

    You can consider adding more security by setting up a NSCA paraphrase which will reside in /etc/nagios/nsca.cfg to which you can place the same paraphrase in all of the nsca-clients you set up by updating /etc/nagios/send_nsca.cfg.

    Consider our example above; I can do the following to add a paraphrase:

    # Configure Client
    sed -i -e 's/^#*password=/password=ABCDEFGHIJKLMNOPQRSTUVWXYZ/g' 
       /etc/nagios/send_nsca.cfg
    # Configure Server
    sed -i -e 's/^#*password=/password=ABCDEFGHIJKLMNOPQRSTUVWXYZ/g' 
       /etc/nagios/nsca.cfg
    # Reload xinetd so it rereads /etc/nagios/nsca.cfg
    service xinetd reload
    

I don’t trust you, I want to repackage this myself!

As always, I will always provide you a way to build the source code from scratch if you don’t want to use what I’ve already prepared. I use mock for everything I build so I don’t need to haul in development packages into my native environment. You’ll need to make sure mock is setup and configured properly first for yourself:

# Install 'mock' into your environment if you don't have it already.
# This step will require you to be the superuser (root) in your native
# environment.
yum install -y mock

# Grant your normal every day user account access to the mock group
# This step will also require you to be the root user.
usermod -a -G mock YourNonRootUsername

At this point it’s safe to change from the ‘root‘ user back to the user account you granted the mock group privileges to in the step above. We won’t need the root user again until the end of this tutorial when we install our built RPM.

Just to give you a quick summary of what I did, here are the new spec files and patch files I created:

  • NSCA RPM SPEC File: Here is the enhanced spec file I used (enhancing the one already provided in the EPEL release found on pkgs.org). At the time I wrote this blog, the newest version of NSCA was v2.7.2-8. This is why I repackaged it as v2.7.2-9 to include my enhancements. I created 2 patches along with the spec file enhancements.
    nrpe.conf.d.patch was created to provide a working NRPE configuration right out of the box (as soon as it was installed) and nrpe.xinetd.logrotate.patch was created to pre-configure a working xinetd server configuration.
  • NRPE RPM SPEC File: Here is the enhanced spec file I used (enhancing the one already provided in the EPEL release found on pkgs.org). At the time I wrote this blog, the newest version of NRPE was v2.14-5. However v2.15 was available off of the Nagios website so this is why I repackaged it as v2.15-1 to include my enhancements.
    nsca.xinetd.logrotate.patch was the only patch I needed to create to prepare a NSCA xinetd server working out of the box.

Everything else packaged (patches and all) are the same ones carried forward from previous versions by their package managers.

Rebuild your external monitoring solutions:

Below shows the long way of rebuilding the RPMs from source.

# Perhaps make a directory and work within it so it's easy to find
# everything later
mkdir nagiosbuild
cd nagiosbuild
###
# Now we want to download all the requirements we need to build
###
# Prepare our mock environment
###
# Initialize Mock Environment
mock -v -r epel-6-x86_64 --init

# NRPE (v2.15)
wget http://repo.nuxref.com/centos/6/en/source/custom/nrpe-2.15-4.el6.nuxref.src.rpm 
mock -v -r epel-6-x86_64 --copyin nrpe-2.15-1.el6.src.rpm /builddir/build

# NSCA (v2.7.2)
wget http://repo.nuxref.com/centos/6/en/source/custom/nsca-2.7.2-10.el6.nuxref.src.rpm 
mock -v -r epel-6-x86_64 --copyin nsca-2.7.2-9.el6.src.rpm /builddir/build

#######################
### THE SHORT WAY #####
#######################
# Now, the short way to rebuild everything is through these commands:
mock -v -r epel-6-x86_64 --resultdir=$(pwd)/results 
   --rebuild  nrpe-2.15-1.el6.src.rpm  nsca-2.7.2-9.el6.src.rpm

# You're done; You can find all of your rpms in a results directory
# in the same location you typed the above command in.  You can 
# alternatively rebuild everything the long way allowing you to
# inspect the content in more detail and even change it for your
# own liking

#######################
### THE LONG WAY  #####
#######################
# Install NRPE Dependencies
mock -v -r epel-6-x86_64 --install 
   autoconf automake libtool openssl-devel tcp_wrappers-devel

# Install NSCA Dependencies
mock -v -r epel-6-x86_64 --install 
   tcp_wrappers-devel libmcrypt-devel

###
# Build Stage
###
# Shell into our enviroment
mock -v -r epel-6-x86_64 --shell

# Change to our build directory
cd builddir/build

# Install our SRPMS (within our mock jail)
rpm -Uhi nsca-*.src.rpm nrpe-*.src.rpm

# Now we'll have placed all our content in the SPECS and SOURCES
# directory (within /builddir/build).  Have a look to verify
# content if you like

# Build our RPMS
rpmbuild -ba SPECS/*.spec

# we're now done with our mock environment for now; Press Ctrl-D to
# exit or simply type exit on the command line of our virtual
# environment
exit

###
# Save our content that we built in the mock environment
###

#NRPE
mock -v -r epel-6-x86_64 --copyout /builddir/build/SRPMS/nrpe-2.15-1.el6.src.rpm .
mock -v -r epel-6-x86_64 --copyout /builddir/build/RPMS/nrpe-2.15-1.el6.x86_64.rpm .
mock -v -r epel-6-x86_64 --copyout /builddir/build/RPMS/nagios-plugins-nrpe-2.15-1.el6.x86_64.rpm .
mock -v -r epel-6-x86_64 --copyout /builddir/build/RPMS/nrpe-debuginfo-2.15-1.el6.x86_64.rpm .

#NSCA
mock -v -r epel-6-x86_64 --copyout /builddir/build/SRPMS/nsca-2.7.2-9.el6.src.rpm .
mock -v -r epel-6-x86_64 --copyout /builddir/build/RPMS/nsca-2.7.2-9.el6.x86_64.rpm .
mock -v -r epel-6-x86_64 --copyout /builddir/build/RPMS/nsca-client-2.7.2-9.el6.x86_64.rpm .
mock -v -r epel-6-x86_64 --copyout /builddir/build/RPMS/nsca-debuginfo-2.7.2-9.el6.x86_64.rpm .

# *Note that all the commands that interact with mock I pass in 
# the -v which outputs a lot of verbose information. You don't
# have to supply it; but I like to see what is going on at times.

# **Note: You may receive this warning when calling the '--copyout'
# above:
# WARNING: unable to delete selinux filesystems 
#    (/tmp/mock-selinux-plugin.??????): #
#    [Errno 1] Operation not permitted: '/tmp/mock-selinux-plugin.??????'
#
# This is totally okay; and is safe to ignore, the action you called
# still worked perfectly; so don't panic!

So where do I go from here?
NRPE and NSCA are both fantastic solutions that can allow you to tackle any monitoring problem you ever had. In this blog here I focus specifically on Linux, but these tools are also available on Microsoft Windows as well. You can easily have 1 Nagios Server manage thousands of remote systems (of all operating system flavours). There are hundreds of fantastic tools to monitor all mainstream applications used today (Databases, Web Servers, etc). Even if your trying to support a custom application you wrote. If you can interface with your application using the command line interface, well then Nagios can monitor it for you. You only need to write a small script with this in mind:

  • Your script should always have an exit code of 0 (zero) if everything is okay, 1 (one) if you want to raise a warning, and 2 (two) if you want to raise a critical alarm.
  • No matter what the exit code is, you should also echo some kind of message that someone could easily interpret what is going on.

There is enough information in this blog to do the rest for you (as far as creating a Nagios configuration entry for it goes). If you followed the 2 rules above, then everything should ‘just work’. It’s truely that easy and powerful.

How do I decide if I need NSCA or NRPE?

NRPE & NSCA High Level Overview

NRPE makes it Nagios’s responsibility to check your application where as NSCA makes it your applications responsible to report its status. Both have their pros and cons. NSCA could be considered the most secure approach because at the end of the day the only port that requires opening is the one on the Nagios server. NSCA does not use a completely secure connection (but there is encryption none the less). NRPE is very secure and doesn’t require you to really do much since it just simply works with the nagios-plugins already available. It litterally just extends these existing Nagios local checks to remote ones. NSCA requires you to configure a cron, or adjust your applications in such a way that it frequently calls the send_nsca command. NSCA can be a bit more difficult to set up but creates some what of a heartbeat between you and the system monitoring it (which can be a good thing too). I pre-configured the NSCA server with a small tweak that will automatically set your application to a critical state if a send_nsca call is missed for an extended period of time.

Always consider that the point of this blog was to state that you can use both at the same time giving you total flexibility over all of your systems that require monitoring.

Credit

All of the custom packaging in this blog was done by me personally. I took the open source available to me and rebuilt it to make it an easier solution and decided to share it. If you like what you see and wish to copy and paste this HOWTO, please reference back to this blog post at the very least. It’s really all I ask.

Sources

I referenced the following resources to make this blog possible:

  • The blog I wrote earlier that is recommended you read before this one:Configuring and Installing Nagios Core 4 on CentOS 6
  • Official NRPE download link; I used all of the official documentation to make the NRPE references on this blog possible.
  • A document identifying the common errors you might see and their resolution here.
  • Official NSCA download link; I used all of the official documentation to make the NSCA references on this blog possible.
  • The NRPE and NSCA images I’m reposting on this blog were taking straight from their official sites mentioned above.
  • Linux Packages Search (pkgs.org) was where I obtained the source RPMs as well as their old SPEC files. These would be a starting point before I’d expand them.
  • A bit outdated, but a great (and simple) representation of how NSCA works with Nagios can be seen here.