Introduction
Apprise is an open source tool that allows you to send a notification through a wide range of messaging services out there (such as Discord, Slack, Telegram, Microsoft Teams, etc). Well when you combine this with Nagios, you open it up to a much larger scope then simply emailing on an alert.

With Apprise you can configure Nagios to text your mobile phone using Amazon’s Web Service, or notify your devops team on Slack and/or Microsoft Teams. You can even trigger an IFTTT event. But it doesn’t just stop there, Apprise already supports over 35+ notification services today (and is always expanding) which means Nagios could leverage all of this too. This blog will explain how you can set up your instance of Nagios to notify more end points then just email.
The Installation
I’m going to presume you have a copy of Nagios already installed. If you don’t you can check out my blog here on how to set up your own copy with CentOS 7. Those who are not using CentOS are certainly not out of luck though, there are lots of blogs out there to get you started.
This blog will assume you have root privileges or have sudoers privileges.
Apprise can be easily added to your system through pip:
# Install Apprise onto the system currently also hosting Nagios
sudo pip install apprise
Configure Nagios
The Nagios configuration files can vary in their location depending on what Linux distribution you’re using. I’m going to just refer to some standard paths used by the stuff I host here (for CentOS/RedHat).
Step 1: Nagios Import Directory
If you’re using the Nuxref RPMs, then you can skip this step and move to the next as you’ll already be configured for this. Those using another distribution will want to update their nagios.cfg to point to a directory we can use to drop in and remove configuration from. The file is presumably going to be located as: /etc/nagios/nagios.cfg):
# Place this anywhere in /etc/nagios/nagios.cfg
# preferably put it near the bottom of the file.

# Definitions for global configuration directory
cfg_dir=/etc/nagios/conf.d
Now make sure this directory exists because this is where we’ll place our new apprise configuration:
# Ensure our global include directory exists that we
# just defined in our nagios.cfg file:
mkdir -p /etc/nagios/conf.d

# Place a dummy file in here so that Nagios doesn't
# throw any errors (as it isn't a fan of include directories
# without configuration files in it).
touch /etc/nagios/conf.d/dummy.cfg
Step 2: Apprise/Nagios Integration
Now we need to let Nagios know about Apprise. We’ll do this by creating the following files called /etc/nagios/conf.d/apprise.cfg
#
# Apprise to Nagios Configuration File
# Place this file as /etc/nagios/conf.d/apprise.cfg
#
# 'notify-host-by-apprise' command definition
define command{
   command_name   notify-host-by-apprise
   command_line   /usr/bin/printf "%b" "- *Notification Type*: $NOTIFICATIONTYPE$\n- *Host*: $HOSTNAME$\n- *State*: \n- *Address*: $HOSTADDRESS$\n- *Info*: $HOSTOUTPUT$\n\n- *Date/Time*: $LONGDATETIME$\n" | /usr/bin/apprise -c /etc/nagios/apprise.yml -n "$HOSTSTATE$" -g "$NOTIFICATIONTYPE$" -t "** $NOTIFICATIONTYPE$ Host Alert: $HOSTNAME$ is $HOSTSTATE$ **"
}

# 'notify-service-by-apprise' command definition
define command{
   command_name   notify-service-by-apprise
   command_line   /usr/bin/printf "%b" "*Notification Type*: $NOTIFICATIONTYPE$\n- *Service*: $SERVICEDESC$\n- *Host*: $HOSTALIAS$\n- *Address*: $HOSTADDRESS$\n- *State*: $SERVICESTATE$\n- *Date/Time*: $LONGDATETIME$\n\n*Additional Info*:\n$SERVICEOUTPUT$\n" | /usr/bin/apprise -c /etc/nagios/apprise.yml -n "$HOSTSTATE$" -g "$NOTIFICATIONTYPE$" -t "** $NOTIFICATIONTYPE$ Service Alert: $HOSTALIAS$/$SERVICEDESC$ is $SERVICESTATE$ **"
}

# Register our contact template that we can reference
define contact{
  ; The name of this contact template
  name                             apprise-contact

  ; service notifications can be sent anytime
  service_notification_period      24x7

  ; host notifications can be sent anytime
  host_notification_period         24x7

  ; send notifications for all service states, flapping events,
  ; and scheduled downtime events
  service_notification_options     w,u,c,r,f,s

  ; send notifications for all host states, flapping events,
  ; and scheduled downtime events
  host_notification_options        d,u,r,f,s

  ; send service notifications via email
  service_notification_commands    notify-service-by-apprise

  ; send host notifications via email
  host_notification_commands       notify-host-by-apprise

  ; Don't register this as it is just a template for future
  ; references by contacts who wish to use the apprise plugin
  register                         0
}
Now for every contact we set up going forward, we can point it to use Apprise. By default Nagios usually provides us a contact.cfg file that contains the generic user nagiosadmin. For those using my packaging, you can find this file at /etc/nagios/objects/contacts.cfg; you’ll want to change it to looks like this:
define contact{
  ; Short name of (Nagios) user
  contact_name    nagiosadmin

  ; This next line used to read generic-contact; but we want to switch it
  ; over to our new Apprise based one:
  use             apprise-contact

  ; Full name of user
  alias           Nagios Admin

  ; not important if using apprise-contact (defined above)
  email           nagios@localhost
}
Before you advance to the next step, you’ll want to run a test flight check on your configuration and make sure it validates okay.
# Perform a flight check on our new configuration (as root)
sudo nagios -v /etc/nagios/nagios.cfg
If you get any errors, you should revisit the first part of this blog and try to iron them out before continuing. If everything is error free, then the next step is to reload our instance of Nagios (if it’s running) so it can re-read this configuration. This can be done with the command:
# You will need to be root to do this; send a SIGHUP
# to all instances of nagios running in memory:
sudo killall -HUP nagios
Step 3: Apprise Configuration
Now we need to prepare our Apprise configuration (/etc/nagios/apprise.yml) and fill it with the notification services we want listen for and who we want to pass it to.
We can associate with Nagios notifications types passed to us through tags. Nagios will pass these along one of the following $NOTIFICATIONTYPE$ when an event occurs; these are:
- PROBLEM: There was an issue with one of the checks.
- RECOVERY: The issue previously set has been cleared.
- ACKNOWLEDGEMENT: An outstanding issue has been acknowledged.
- FLAPPINGSTART: Flapping is a state where a service has a PROBLEM associated with it and then moments later has a RECOVERY. This is the state called FLAPPING. When this process occurs too many times in a row, this alert gets set.
- FLAPPINGSTOP: The service that was previously FLAPPING is no longer doing so.
- FLAPPINGDISABLED: Someone just disabled FLAPPING for this service/host.
- DOWNTIMESTART: The scheduled downtime for this service/host has begun.
- DOWNTIMEEND: The scheduled downtime is over.
- DOWNTIMECANCELLED: Someone just cancelled the scheduled downtime for this service/host.
Knowing the above notification types that we’ll receive, here is what an Apprise configuration file located at /etc/nagios/apprise.yml might look like:
# This file should be placed in /etc/nagios/apprise.yml

# NOTE: THIS IS JUST AN EXAMPLE CONFIGURATION FILE. YOU WILL WANT
#       TO CUSTOMIZE YOUR OWN WITH THE SERVICE(S) OF YOUR CHOICE
#       VISIT https://github.com/caronc/apprise TO SEE WHAT IS
#       AVAILABLE AND HOW THEY WORK.

# Identify all of the global notification types we want to flag on.
tag:
  - PROBLEM
  - RECOVERY
  - FLAPPINGSTART
  - FLAPPINGSTOP

# Now we want to define our Apprise URLS; you'll want to visit
# https://github.com/caronc/apprise to see all of the supported
# services and how to build their URLs.
urls:

  # Maybe we want to notify a custom service we're hosting to
  # monitor and track Nagios status; Check out the following
  # for more details https://github.com/caronc/apprise/wiki/Notify_json

  - json://localhost

  # Maybe we want to notify a Slack channel; more details on this
  # are here: https://github.com/caronc/apprise/wiki/Notify_slack
  - slack://T1JJ3T3L2/A1BRTD4JD/TIiajkdnlazkcOXrIdevi7F/#nuxref

  # the Apprise YAML configuration is quite powerful, the
  # following prepares the email URL and sends an email to each
  # user identified below:
  - email://user:password@gmail.com
      - to: george@example.com
      - to: admin@example.com

  # More details on the emails can be found here:
  # https://github.com/caronc/apprise/wiki/Notify_email

  # We can also individually disperse the tags in the same config
  # file.  The below tags will override the globals defined above.
  # A use case for this would be that maybe we just want to
  # send certain notification types to say... the DevOps team:
  - email://user:password@gmail.com
      - to: devops@example.com
        tag: DOWNTIMESTART, DOWNTIMEEND, DOWNTIMECANCELLED
Once you’re file is all ready, be sure this file is readable by Nagios (to keep it away from prying eyes), but otherwise you’re all set and ready to go!
# Here is what one might do to protect this apprise configuration
chmod 640 /etc/nagios/apprise.yml
chown nagios.root /etc/nagios/apprise.yml
Verification
To be sure everything works, you may want to just test that you got all of your configuration right You can test this using manually as follows:
# Test our configuration with apprise using the PROBLEM tag
# -vvv for some verbose debugging in-case we need it.
apprise -c /etc/nagios/apprise.yml \
    -n CRITICAL -g PROBLEM \
    -vvv \
    -t "A Test Title" \
    -b "a Test Body"
Here is a screenshot of a test error displayed on gitter.im that was sent by Nagios using Apprise:

Sources
- Nagios Core
- Apprise GitHub Page
- Apprise PyPI Page
- Nagios Core 4.x Setup for CentOS 7.x: Part 1 of a Nagios blog series.
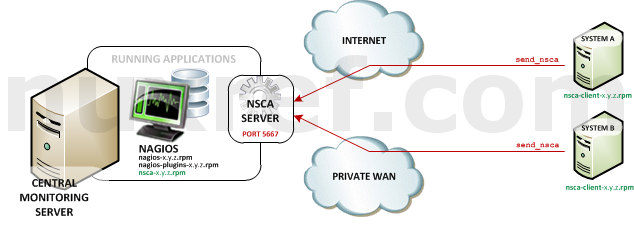
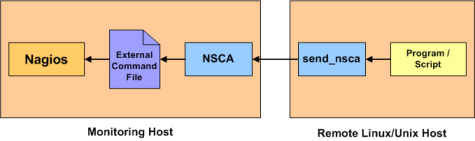
- NRDP for Nagios Core on CentOS 7.x: Part 2 of a Nagios blog series.
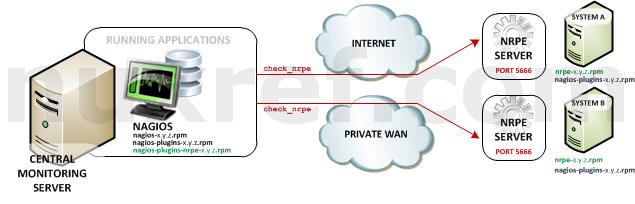
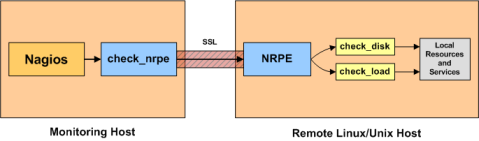
- NRPE for Nagios Core on CentOS 7.x: Part 3 of a Nagios blog series.