Introduction
A few years ago I blogged about setting up Nagios Core 4.x for CentOS 6.x. I later made a blog on setting up NSCA and NRPE too. But times have changed so I figured it was time to do an updated blog for CentOS 7.x and Nagios.
Some new great tools I’ve packaged to make a load and go setup for everyone is:
- Nagios Core v4.x: updated RPM packaging which I continued to maintain and carry forward from my previous blogs.
- Nagios Plugins v2.x: A ton of out of the box working plugins.
Best of all, with my RPMs, you can run SELinux in full Enforcing mode for that extra piece of mind from a security standpoint!
Nagios Core
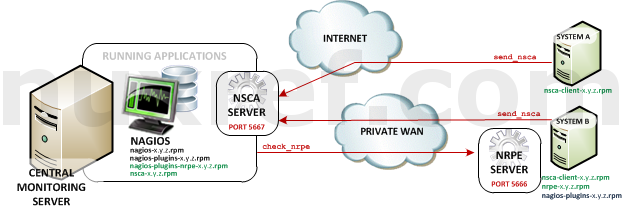
Nagios (for those who don’t know) is an application that allows us to monitor other system/applications we manage. It’s primary function is to immediately bring to our attention any outage or anomaly is detected with our systems. This tool is completely free and should be an essential component of anyone’s business infrastructure.
The current version of Nagios (at the time of writing this blog) is v4.2.2. You can download the latest version from my repository (if you’re set up) as follows:
# Install Nagios Core using NuxRef repositories
# at: https://nuxref.com/repo
yum install -y nagios nagios-selinux
You can also download the packages manually if you wish using this table:
| Package | Download | Description |
|---|---|---|
| nagios | el7.rpm | Nagios Core IV is the the actual monitoring server we can use to monitor our applications. |
| nagios-selinux | el7.rpm | An add-on package that allows you to run Nagios in Enforcing Mode. Note: This RPM is not required by Nagios to run correctly. |
| nagios-contrib | el7.rpm | Extra tools that add to the great features Nagios already offers (such as distributed monitoring). These tools are not discussed in this blog entry; but maybe useful to you. Note: This RPM is not required by Nagios to run correctly. |
| nagios-devel | el7.rpm | Header files for developers who want to build using the libnagios shared library. Note: This RPM is not required by Nagios to run correctly. |
Note: The source rpm can be obtained here which builds everything you see in the table above. It’s not required for the application to run, but might be useful for developers or those who want to inspect how I put the package together.
Configure Nagios Core
Once Nagios is installed it can be started like so:
# Start Nagios
systemctl start nagios.service

# If you want Nagios to start after the system is rebooted, you
# can type the following:
systemctl enable nagios.service

# Now we want to turn on Apache if it's not running, otherwise
# reload the configuration if it is:
systemctl status httpd.service && \
   systemctl start httpd.service ||\
   systemctl reload httpd.service
If you followed the instructions above you should be able to access the (Nagios) monitoring website right away by visiting http://localhost/nagios. If you’re installing this on another server you may need to open your web ports to access the Nagios Monitoring site:
# The following commands should be ran on your Nagios Server.
# It will enable our http (and secure https) port on our firewall so our
# monitoring website can be accessed remotely:
firewall-cmd --permanent --add-service=http
firewall-cmd --add-service=http
firewall-cmd --permanent --add-service=https
firewall-cmd --add-service=https
| Nagios Credentials | |
|---|---|
| Login | nagiosadmin |
| Password | nagiosadmin |
You’ll be prompted for a user/pass combination; at this time the default values are defined in the table:
Once you’ve logged in, you can click on links like Services (under the Current Status heading) which will list to you all of the system services you’re currently monitoring and their status:

In the example, you can see Nagios has picked up on a high system load (denoted by the yellow warning entry).
Nagios at it’s most basic level is set up at this point and can be maintained by having a look at the following directories:
/etc/nagios/nagios.cfg:
The main configuration file that is read by Nagios when starting up. The only things you may want to change in here are:
| Directive | Description |
|---|---|
| date_format | The default is us (MM-DD-YYYY HH:MM:SS), but personally I like iso8601 (YYYY-MM-DD HH:MM:SS). |
# simple 1-liner to toggle date_format to iso8601: sed -i -e 's/^\(date_format\)=.*$/\1=iso8601/g' \ /etc/nagios/nagios.cfg |
|
| check_for_updates | The default is 1 (which is to check for updates). Personally, I don’t want my web page pinging Nagios every time i access the website for updates. Here is how you can do the same: |
# disable update check: sed -i -e 's/^\(check_for_updates\)=.*$/\1=0/g' \ /etc/nagios/nagios.cfg |
|
/etc/nagios/objects/contacts.cfg:
This is where a default contact has been created. Feel free to open this up and add your name and (especially the) email address.
/etc/nagios/objects/commands.cfg:
All of the possible checks Nagios can perform on it’s own (without any plugins or extensions) are identified here. It’s as easy as defining a command_name (give it some name) and then tell it what you want to execute with the command_line directive.
A Nagios command is really simple to write; you can write one in any language you want. Here is one written in bash shell:
#!/bin/bash
# Path: /usr/lib64/nagios/plugins/check_temp_file_count
# Please keep in mind this script is pretty useless but
# it's goal is to show you how easy it is to write a
# script for Nagios.
#
# The rules are simple:
# Whatever we echo to the screen get's displayed to Nagios
# and our return value from our script/program will
# determine the color code (and whether or not we alarm)

# A return code of zero (0) tells Nagios everything is okay
RET_OKAY=0

# A return code of one (1) tells Nagios we're reporting a warning
# about whatever it is we're monitoring
RET_WARN=1

# A return code of two (2) tells Nagios we're reporting a critical
# error
RET_CRIT=2

# I define 3 here, but quite honestly, anything you return that
# does not fit in the 0, 1 or 2 response type (as identified
# above) is considered an unknown state.  Try to avoid this
# type if you can.
RET_UNKN=3

# As a test script we'll count all of the files and directories
# in the /tmp folder
COUNT=$(find /tmp 2>/dev/null | wc -l)

# If we have less then 10 files we'll tell Nagios everything
# is okay:
if [ $COUNT -lt 10 ]; then
   echo "$COUNT files; everything is good!"
   exit $RET_OKAY
fi

# If we have less then 30 files we'll tell Nagios that
# it should report a warning
if [ $COUNT -lt 30 ]; then
   echo "$COUNT files; caution!"
   exit $RET_WARN
fi

# Anything more we should report a critical alarm
echo "$COUNT files; Critical!!"
exit $RET_CRIT
If you’re familiar with Perl, the Nagios team has made a framework with it which you use to make your packages too! I’ve already gone ahead and packaged the perl-Nagios-Monitoring-Plugin rpm for you if you want it.
Nagios will associate /usr/lib64/nagios/plugins/ as it’s plugin directory; so you should save any plugins you create there (to keep them all in a common location). Plus if you intend to use SELinux, this is the directory that Nagios is allowed to execute from.
Our entry in the commands.cfg for this new script might look like this:
; 'check_temp_file_count' command definition
; $USER1$ gets translated automatically to our Nagios Plugin directory
; so in our case: /usr/lib64/nagios/plugins/
; Ideally you should call the command the same name as the checking
; tool you wrote.
define command{
	command_name	check_temp_file_count
	command_line	$USER1$/check_temp_file_count
	}
/etc/nagios/objects/localhost.cfg:
This is just a general configuration file for the very machine Nagios is running on. If you open it up, you’ll see that it defines a lot of entries that reference commands (defined already in the commands.cfg file).
A new entry in the commands.cfg for this new script might look like this:
; the 'use' directive identifies a template of information to save
; us from typing it all out here.  For now; just leave this as
; local-service.
;
; The 'hostname' defines our server (defined at the very top of this same
; file. Since the host at the to was defined as 'localhost', we need
; to use this same name here too
;
; The next field is just a description field; it will be how this service
; is presented on Nagios through the website
;
; The check_command is the name we gave it in the commands.cfg
; file.
define service{
        use                             local-service
        host_name                       localhost
        service_description             Count our Temporary Files
        check_command                   check_temp_file_count
}
Check to see if Nagios has any errors with any new configuration you provided:
# This command just tells Nagios to read in it's configuration
# and check if it appears valid:
nagios -v /etc/nagios/nagios.cfg
If everything checks out okay, go ahead and reload Nagios with our
new configuration:
# Reload Nagios
systemctl reload nagios.service
Nagios Plugins
If you’ve installed Nagios, there isn’t really any good reason why you shouldn’t just install the Nagios Plugins too. This is just more tools and checking scripts to make Nagios all that more powerful. The best part is, these tools have been tested over the years, so they’re already proven to be reliable and will allow you to accomplish most monitoring without much effort.

It’s important to note that the Nagios Plugin RPMs are NOT required by Nagios to run correctly. They merely just improve it’s existing functionality. You may however want to install the plugins you’re interested in that monitor systems you’re using.
The current version of the Nagios Plugins (at the time of writing this blog) is v2.1.3. You can download the latest version from my repository (if you’re set up) as follows:
# Install Nagios Core using NuxRef repositories
# See: https://nuxref.com/repo for more information
yum install -y nagios-plugins nagios-plugins-selinux
You can also download the packages manually if you wish using this table:
| Package | Download | Description |
|---|---|---|
| nagios-plugins | el7.rpm | 50+ plugins that are fully adaptable to Nagios in every way. If you’re planning on installing Nagios, don’t forget about adding this package for it’s convenience! |
| nagios-plugins-selinux | el7.rpm | An optional add-on package that allows you to use the Nagios Plugins in Enforcing Mode. |
| nagios-plugins-ldap | el7.rpm | A Nagios plugin that can be used to check integrity and data entries within an LDAP database. |
| nagios-plugins-mysql | el7.rpm | A Nagios plugin that can be used to check integrity and data entries within an MySQL (or Maria) database. |
| nagios-plugins-ntp | el7.rpm | A Nagios plugin that can be used to check the NTP status of the machine it’s called on. |
| nagios-plugins-pgsql | el7.rpm | A Nagios plugin that can be used to check integrity and data entries within an PostgreSQL database. |
| nagios-plugins-samba | el7.rpm | A Nagios plugin that can be used to check status of your Samba mounts and their availability. |
| nagios-plugins-snmp | el7.rpm | A Nagios plugin that can query SNMP enabled appliances (routers, firewalls, switches, servers) and convert their output back to something Nagios can monitor or report. |
Note: The source rpm can be obtained here which builds everything you see in the table above. It’s not required for the application to run, but might be useful for developers or those who want to inspect how I put the package together.
The main thing to know about this package after it is installed is the slew of new plugins available to you in /usr/lib64/nagios/plugins/ and a config file to get you started which references most of them in /etc/nagios/conf.d/nagios-plugin-commands.cfg.
Extra Plugins
There are a lot of great plugins on Nagios Exchange! I packaged just a few of them because they required patches and tweaks to work out of the box. All of these are available on my repository, but feel free to haul them down directly here:
| Package | Download | Description |
|---|---|---|
| nagios-plugins-lvm | el7.rpm / src.rpm / NE Source | This plugin finds all LVM logical volumes, checks their used space, and compares against the supplied thresholds. |
| nagios-plugins-crm | el7.rpm / src.rpm / NE Source | A plugin for monitoring a Pacemaker/Corosync cluster. Note: that this plugin requires perl-Nagios-Monitoring-Plugin to work. |
| nagios-plugins-drbd84 | el7.rpm / src.rpm / NE Source | A plugin for monitoring a DRBD v8.4 setup. |
Credit
This blog took me a very (,very) long time to put together and test! The repository hosting alone accommodates all my blog entries up to this date. All of the custom packaging in this blog was done by me personally. If you like what you see and wish to copy and paste this HOWTO, please reference back to this blog post at the very least. It’s really all I ask.
Sources
- Use Apprise to greatly extend the notifications Nagios can deliver to (to such locations like Telegram, Discord, Amazon SNS, Twilio, etc.
- Installing Nagios Core 4 on CentOS 6 is a blog I wrote 3 years ago which is still applicable today. All of the packages identified here have been forward packaged for CentOS 7.x.
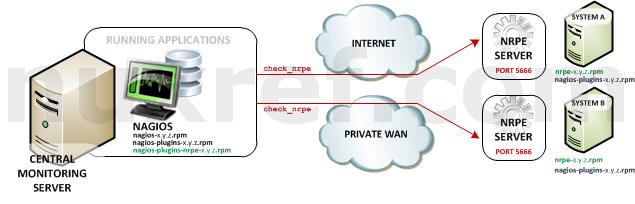
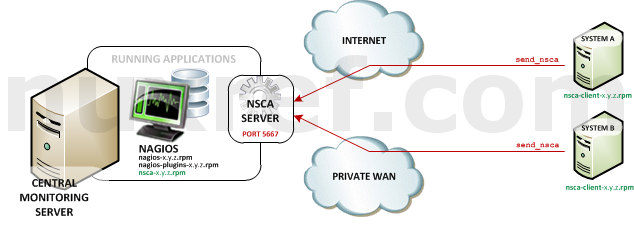
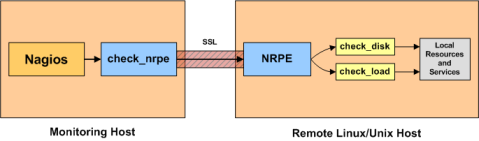
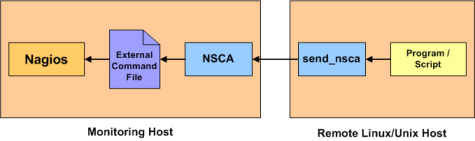
- Configuring and installing NRPE and NSCA into Nagios Core 4 on CentOS 6 is another blog that is still got great information that is applicable to this blog.
- The Nagios Official Website
- The Nagios Plugins
- Nagios Exchange: A great community where people share tons of working Nagios scripts that can monitor just about anything.
The remaining portions of this series can be found here:
- Part 2 – NRDP for Nagios Core on CentOS 7.x: This blog explains how awesome NRDP really is and why it might become a vital asset to your own environment. It’s also provides the first set of working RPMs (with SELinux support of course) of it’s kind.
- Part 3 – NRPE for Nagios Core on CentOS 7.x: This blog explains how to set up NRPE (v3.x) for your Nagios environment. At the time this blog was written, there was no packaging of it’s kind for this version. So allow me be the first to share it with you!